Fishbone Diagram Template
Uncover the root causes of problems and work to find solutions with a Fishbone Diagram.
Trusted by top companies


About this template
What is the Ishikawa Fishbone Diagram?
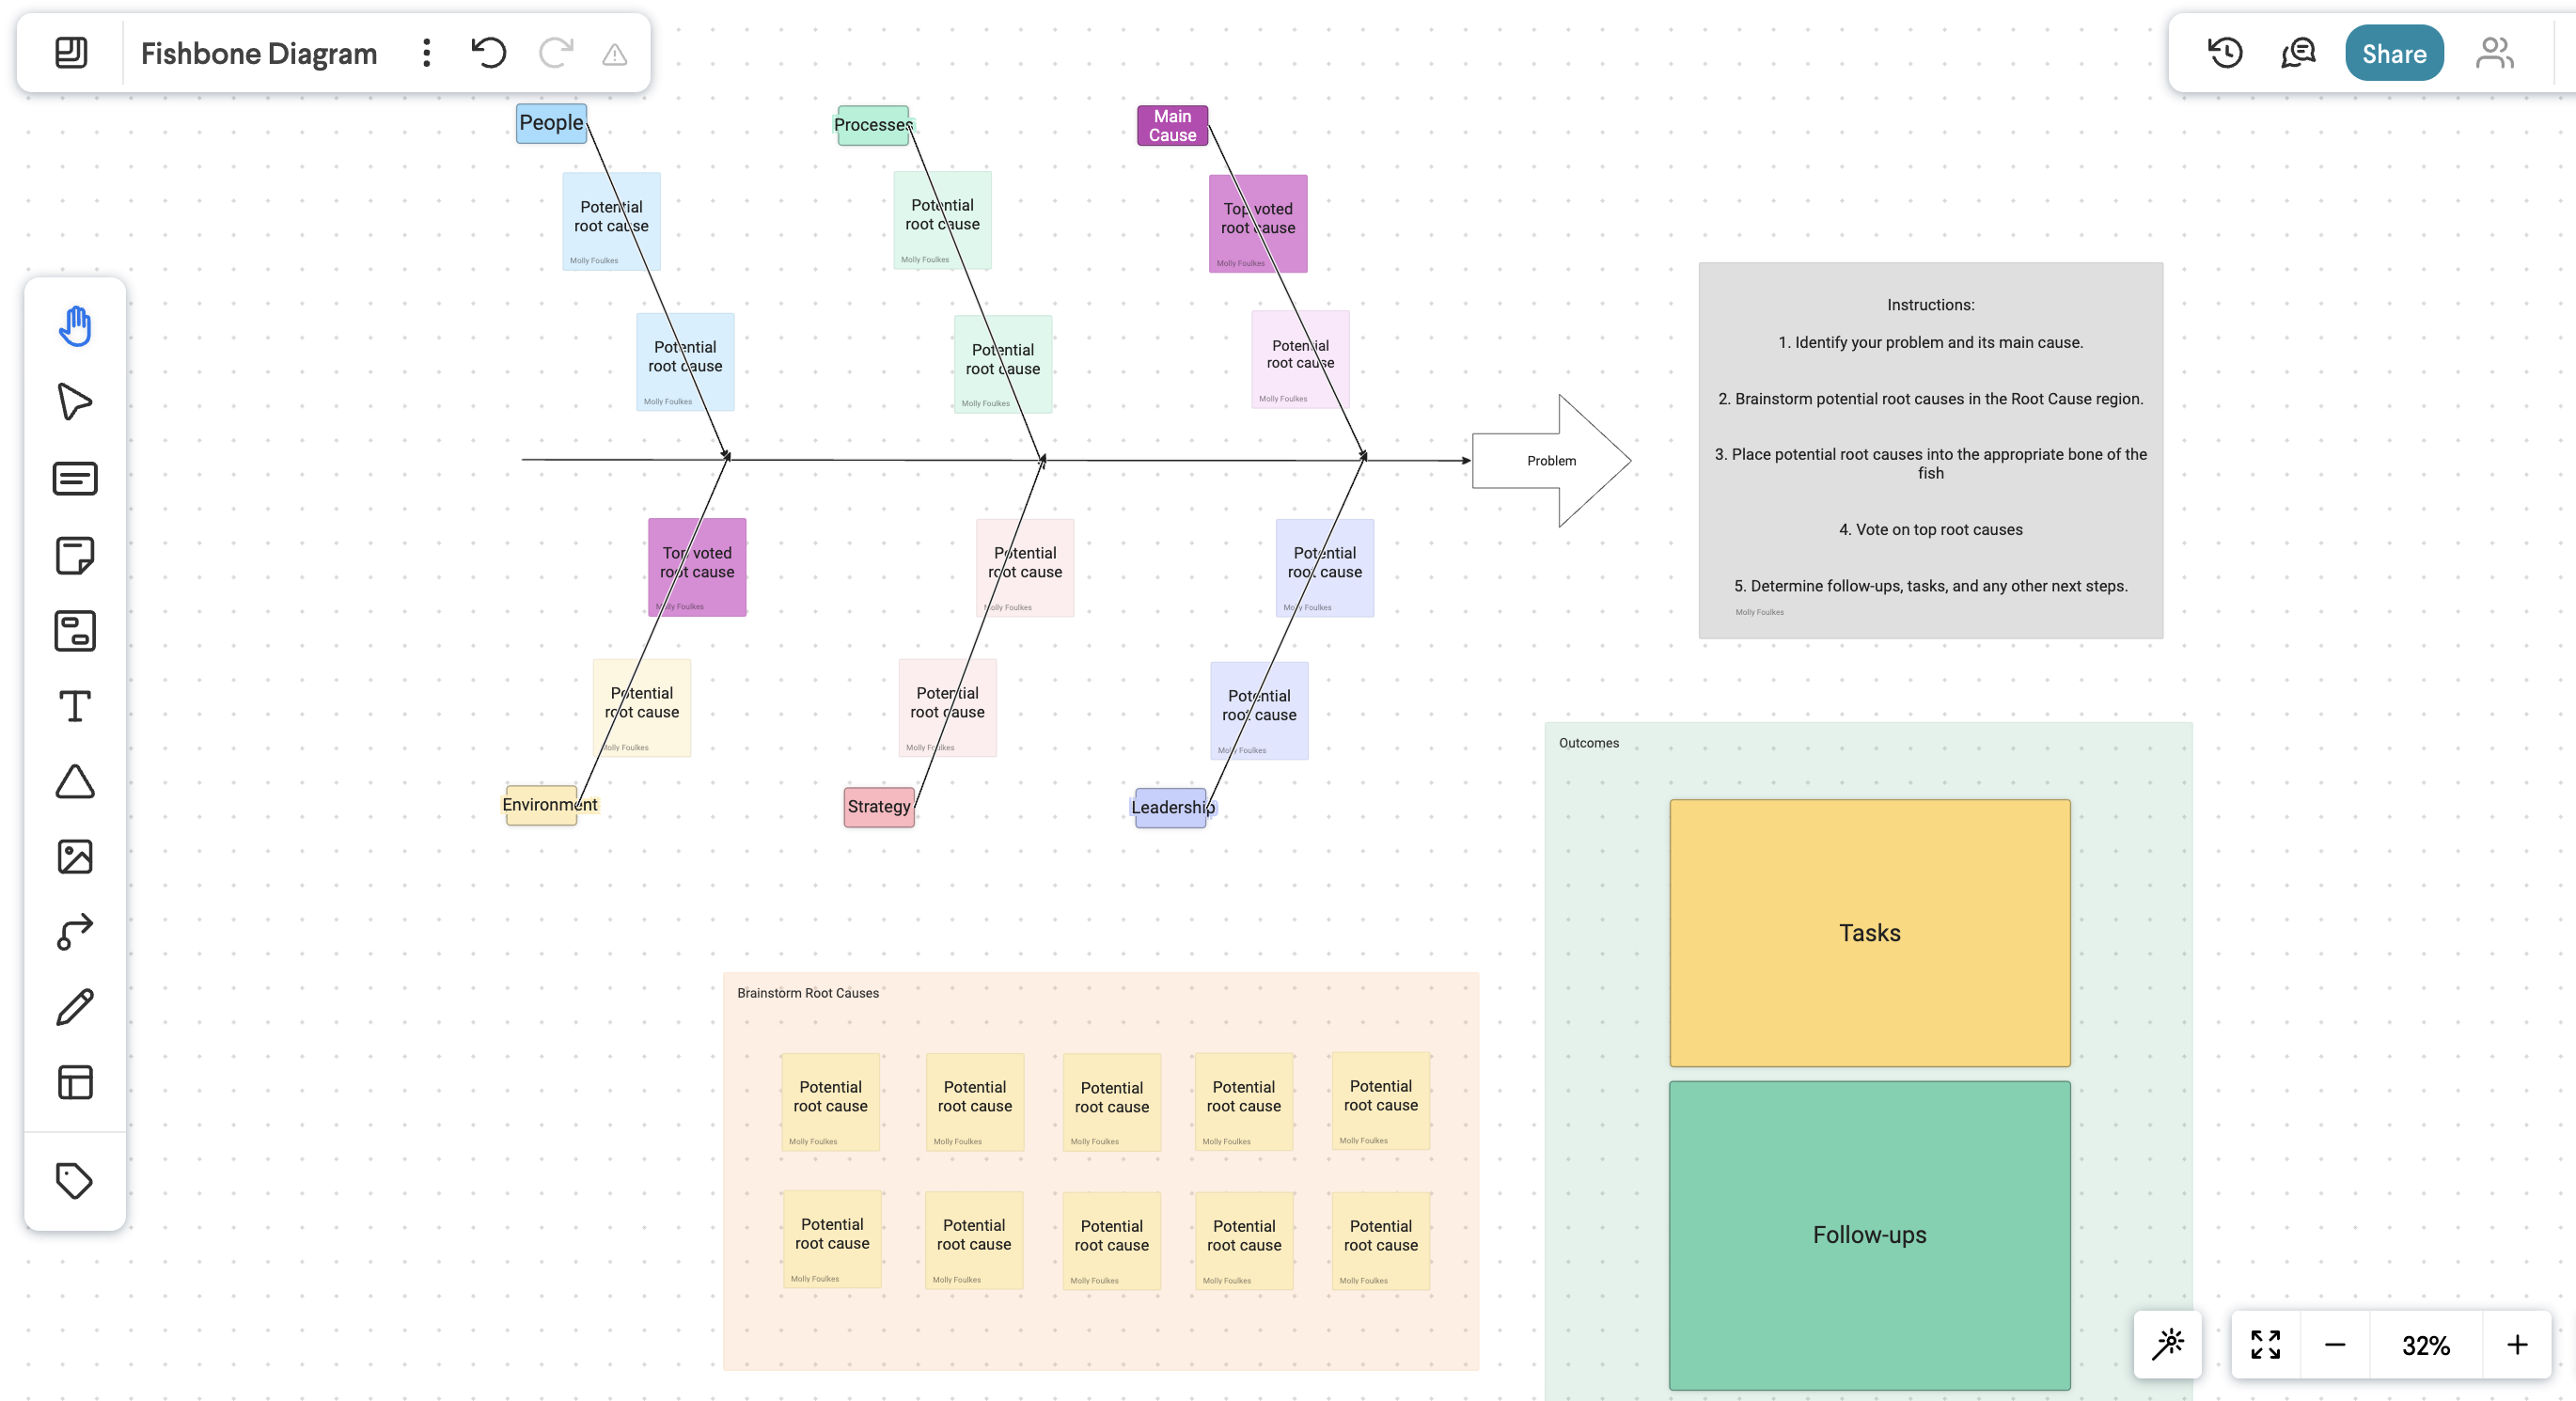
Also known as an Ishikawa or cause-and-effect diagram, the Fishbone diagram is a visual tool used to systematically identify the root causes of a problem. Shaped like a fish's skeleton, the structure is designed to help your team brainstorm and categorize factors contributing to an issue, such as people, methods, machines, materials, measurements, and environment, facilitating root cause analysis and process improvement.
As a group, you can utilize the Fishbone template to brainstorm potential root causes of the problem you are facing. Then, vote on what you believe to be the main or most pressing issue to tackle. What you are left with is clear cut next steps to take to start solving your problem.
Creating your own fishbone diagram in Whiteboard
Getting Started
To start using the Fishbone Diagram Template in a group setting, start by clearly defining the problem you want to analyze. Write this problem at the head of the diagram. Gather your team and brainstorm potential causes, categorizing them under major headings such as people, methods, machines, materials, measurements, and environment. Encourage open discussion and input from all team members to ensure a comprehensive analysis.
Once you have populated the diagram with potential causes, discuss each category to identify the most likely root causes. During this time you can also use emoji reactions or comments to silently vote on your top concerns. Then use this collaborative process to prioritize which issues to address first. This visual and systematic approach helps the team understand the complexity of the problem and develop targeted solutions, fostering effective problem-solving and process improvement.
Utilize comments, emojis, regions, or different colors to group different outcomes or preferences to easily visualize or present your thinking to others.
Key Elements
- Problem: Add the problem to be address to the arrow at the front of the fishbone diagram.
- Bones: After brainstorming root causes, place the potential causes across the "bones", with each bone representing a theme encompassing the potential causes under it.
- Root Causes: Group all potential root causes in this region, add more sticky notes as needed.
- Outcomes: Use this region to group the outcomes of the discussion and any tasks or next steps you agree on.
Info
- Diagramming
- Design
- Project management
- Research
Take a thoughtful approach to your team problem-solving processes with the Frameable Whiteboard Fishbone Diagram template.